Bridge Structural Monitoring: End-to-End Guide
In August 2016, the Majerhat Bridge in Kolkata showed visible distress signals for months before its partial collapse killed three people and disrupted a critical arterial corridor for over a year. Post-incident investigations confirmed that no continuous structural monitoring was in place. India operates more than 1.5 lakh bridges on its national and state highway network, and the Ministry of Road Transport and Highways has mandated periodic structural inspection under IRC SP-35 — yet periodic visual inspection alone cannot capture the sub-millimetre deformations, micro-crack propagation, or dynamic load effects that precede catastrophic failure. Bridge structural monitoring, implemented as a continuous, sensor-based system, is the engineering response to that gap.
This guide walks through every stage of a bridge monitoring system — from sensor selection and installation through data acquisition, telemetry, processing, and the bridge data dashboard — with reference to applicable Indian Standards and real deployments across India.
Key Takeaways
- Bridge structural monitoring is a continuous, sensor-based process governed in India by IRC SP-35, IRC SP-37, IRC:6, and IRC:114, and is increasingly mandated for long-span and critical bridges by NHAI and RVNL.
- A complete SHM bridge system integrates multiple sensor types — strain gauges, accelerometers, displacement transducers, tiltmeters, and crack meters — feeding a centralised data acquisition unit and cloud dashboard.
- Wireless DAQ architectures reduce cabling cost and installation time on long-span and cable-stayed bridges without sacrificing data fidelity at sampling rates up to 1000 Hz for dynamic channels.
- Digital twin integration, as demonstrated in the RITES 3D Digital Twin and VR Visualization Platform for Bridge Health Monitoring, enables condition-state visualisation and predictive maintenance planning.
- Structural thresholds — alert, alarm, and action levels — must be defined before deployment and linked to automated notifications so that engineers receive actionable data, not raw numbers.
What Is Bridge Structural Monitoring?
Bridge structural monitoring is the continuous or periodic measurement of physical parameters — strain, displacement, acceleration, tilt, crack width, temperature, and load — across a bridge structure to assess its real-time condition, detect anomalies, and support maintenance decisions. It is distinct from periodic visual inspection in that it captures time-series data at engineering resolution, enabling trend analysis, fatigue assessment, and early warning against threshold exceedances.
Under IRC SP-35 (Guidelines for Inspection and Maintenance of Bridges), bridges are classified by span, traffic volume, and structural type, with inspection frequencies ranging from routine annual checks to special inspections triggered by seismic events, floods, or overloading incidents. A permanent bridge monitoring system supplements these inspections by providing continuous data between inspection cycles — particularly critical for bridges on seismic zones III, IV, and V as defined under IS 1893.
For bridge structural health monitoring instrumentation and sensor packages, the selection of sensor technology depends on the structural form: a simply supported prestressed concrete girder bridge has different monitoring priorities than a cable-stayed or extra-dosed bridge, where cable force variation and pylon tilt are primary concerns.
Sensor Selection: Matching Instrument to Structural Behaviour
Every bridge monitoring system begins with a sensor schedule derived from a structural monitoring plan. The plan identifies critical sections — mid-span, support zones, cable anchorages, expansion joints, and substructure elements — and assigns measurement parameters to each. The following sensor types are standard in Indian SHM bridge deployments:
- Vibrating wire strain gauges (VWSG): Measure strain in concrete and steel members with resolution down to 1 micro-strain. Suitable for long-term embedment in concrete decks and girders. Operating range typically ±3000 micro-strain; temperature compensation built in via thermistor.
- MEMS accelerometers: Capture dynamic response — natural frequencies, mode shapes, and peak ground acceleration during seismic events. Sampling rates of 200–1000 Hz are standard for modal analysis. Critical for bridges in IS 1893 seismic zones.
- Linear variable differential transformers (LVDT) and displacement transducers: Monitor deflection at mid-span and relative movement at expansion joints. Resolution of 0.01 mm is achievable; range selected per expected live-load deflection under IRC:6 design loads.
- Tiltmeters: Track rotation at pier caps, abutments, and pylons. Biaxial MEMS tiltmeters with resolution of 0.001° are used on cable-stayed bridges to monitor pylon verticality.
- Crack meters: Measure crack width progression at identified crack locations in concrete elements. Vibrating wire type preferred for long-term stability.
- Load cells and weigh-in-motion (WIM) sensors: Quantify actual traffic loading versus IRC:6 design assumptions, enabling fatigue life assessment.
- Corrosion potential sensors: Embedded in reinforced concrete decks to monitor half-cell potential per IS 13311, providing early warning of rebar corrosion in aggressive environments.
Sandeep Gupta, IRSE, former Chief Administrative Officer of Indian Railways and Strategic Advisor at Geolook, notes that cable-stayed and extra-dosed bridges require dedicated cable force monitoring — typically via elasto-magnetic sensors or accelerometer-based frequency methods — because cable force variation directly affects deck stress distribution and fatigue accumulation at anchorage zones.
Data Acquisition: From Field Signal to Digital Record
Raw sensor signals — millivolt outputs from VWSGs, frequency counts from vibrating wire sensors, or digital MEMS outputs — must be conditioned, digitised, time-stamped, and stored before they carry engineering meaning. The data acquisition unit (DAQ) is the hardware layer that performs this function.
For a bridge monitoring system, DAQ selection criteria include channel count, sampling rate per channel, input type compatibility (vibrating wire, 4–20 mA, 0–5 V, RS-485, SDI-12), onboard storage capacity, and communication protocol support (GSM/4G, LoRa, Ethernet, or fibre). Industrial-grade DAUs operating at −40°C to +70°C are specified for bridges exposed to diurnal temperature swings exceeding 40°C, as is common in Rajasthan, Ladakh, and the Indo-Gangetic plain.
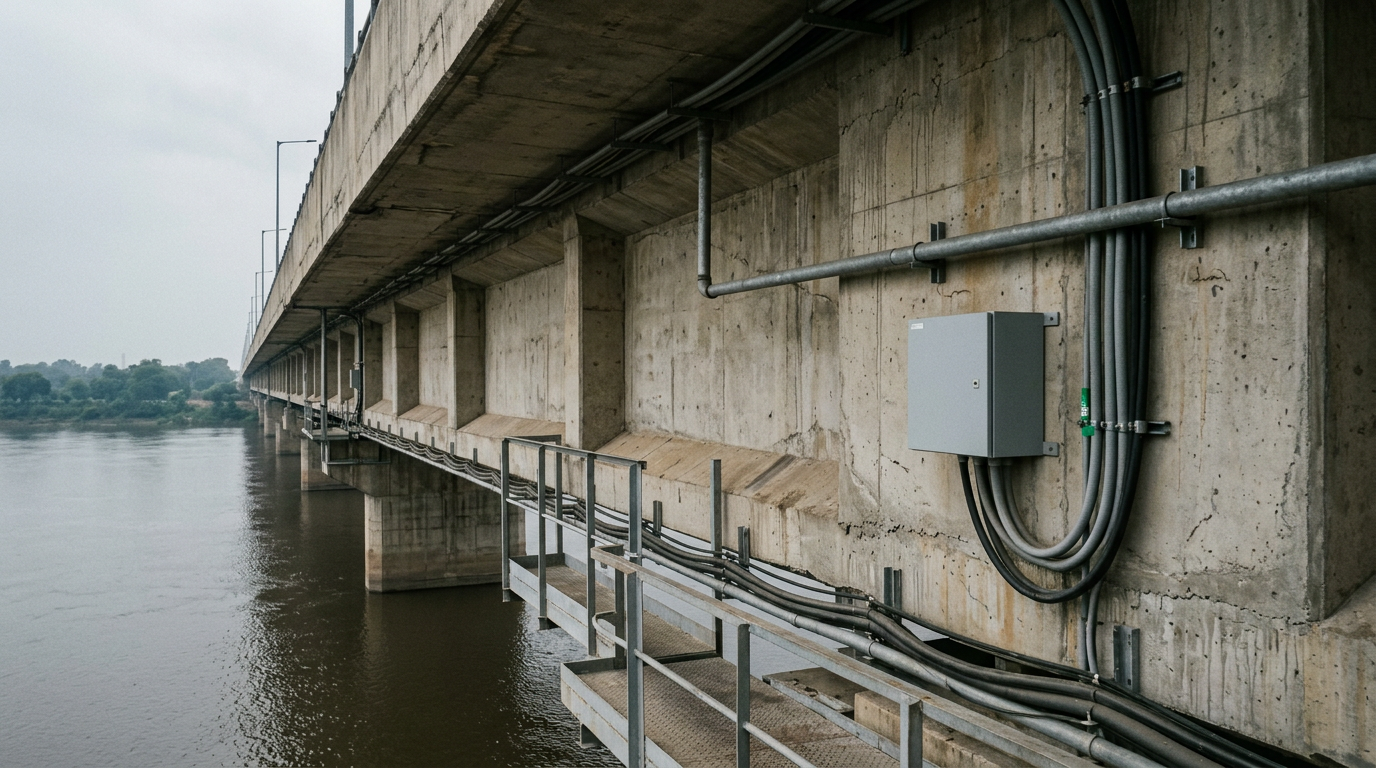
Geolook supplied wireless DAQ units to Neeladari Buildtech for a Bridge Health Monitoring System deployment, demonstrating that wireless architectures can eliminate the cable runs that are both costly and vulnerable to vandalism on long-span structures. For multi-span bridges, a distributed DAQ topology — with node units at each span feeding a central gateway — reduces cable length while maintaining synchronised sampling across the structure.
Explore Geolook's datalogger and DAQ hardware for structural monitoring applications to understand channel configurations and communication options available for bridge deployments.
Telemetry and Communication Architecture
Data collected at the DAQ must reach the processing server reliably, even when the bridge is in a remote location — a gorge crossing in Himachal Pradesh, a river bridge in the Brahmaputra flood plain, or a viaduct in a tunnel approach zone. Communication architecture choices and their trade-offs are summarised in the comparison table below.
| Communication Method | Typical Latency | Bandwidth | Best Suited For | Limitation in Indian Context |
|---|---|---|---|---|
| 4G LTE cellular | <1 second | Up to 50 Mbps | Urban and semi-urban bridges with cellular coverage | Coverage gaps in remote gorges and hilly terrain |
| LoRaWAN | 1–10 seconds | 0.3–50 kbps | Low-power, low-data-rate static sensors over long range | Not suitable for high-frequency dynamic channels (>10 Hz) |
| Fibre optic (wired) | <1 ms | Gbps | High-channel-count, high-frequency dynamic monitoring | Installation cost and vulnerability to construction damage |
| Wi-Fi / local LAN | <10 ms | Up to 300 Mbps | Short-span bridges with nearby control room | Range limited to ~100 m without repeaters |
| VSAT satellite | 600–800 ms | 2–10 Mbps | Remote bridges with no terrestrial connectivity | High latency; not suitable for real-time seismic alerting |
| Hybrid (4G + LoRa) | Variable | Adaptive | Mixed sensor types on long-span bridges | Requires gateway-level protocol translation |
For most Indian highway bridges under NHAI jurisdiction, a hybrid 4G and LoRa architecture provides the best balance of real-time dynamic data transmission and low-power static sensor polling. Redundant SIM cards from two network operators are standard practice to ensure uptime in areas with single-operator dead zones.
Data Processing and Threshold Management
Raw time-series data from a bridge monitoring system has no operational value until it is processed against engineering thresholds. Processing layers typically include: signal filtering (to remove electrical noise and aliasing artefacts), temperature compensation (critical for VWSGs, where apparent strain due to thermal expansion must be separated from structural strain), and statistical aggregation (10-minute means, hourly maxima, and event-triggered snapshots).
Threshold management follows a three-level alert hierarchy common in SHM bridge practice:
- Alert level: A parameter approaches a predefined limit — typically 70–80% of the design threshold. The system logs the event and notifies the monitoring engineer by email or SMS.
- Alarm level: The parameter exceeds 90% of the design threshold. Automated notification escalates to the bridge owner (NHAI, RVNL, PWD) and the structural consultant.
- Action level: The parameter exceeds the design threshold or a rate-of-change criterion. The protocol may include traffic restriction, emergency inspection, or bridge closure pending structural assessment.
Threshold values are derived from the structural design model — allowable mid-span deflection under IRC:6 live loads (typically L/600 for prestressed concrete bridges per IRC:112), permissible crack widths (0.2 mm for aggressive exposure per IS 456), and natural frequency shift limits that indicate stiffness degradation. IIT-Mandi's bridge health monitoring accessories supply project demonstrates how academic institutions are integrating sensor data with finite element model updating to refine these thresholds dynamically as the structure ages.
Learn more about why is structural health monitoring important for bridges and how threshold-based alerting prevents service disruption.
The Bridge Data Dashboard: Visualisation and Reporting
The bridge data dashboard is the operational interface through which engineers, asset managers, and government clients interact with monitoring data. A well-designed dashboard translates gigabytes of sensor time-series into condition indicators, trend plots, and alert logs that support maintenance decisions without requiring the user to process raw data manually.
Core dashboard capabilities for a SHM bridge deployment include: live parameter displays with colour-coded status (green/amber/red against alert/alarm/action thresholds), historical trend plots with configurable time windows, automated daily and monthly PDF reports for submission to NHAI or RVNL, event logs with timestamp and sensor ID, and map-based bridge inventory view for multi-bridge portfolios.
RITES Ltd engaged Geolook for a 3D Digital Twin and VR Visualization Platform for Bridge Health Monitoring System — a deployment that extends the conventional dashboard into an immersive 3D environment where sensor readings are overlaid on a georeferenced structural model. Engineers can navigate the digital twin, click on a sensor node, and retrieve its full measurement history, dramatically reducing the time required to correlate a sensor anomaly with its physical location on the structure. This approach aligns with the broader push by MoRTH and NHAI toward asset digitalisation under the PM Gati Shakti framework.
For a detailed look at the software layer, see Geolook's SHM software platform for bridge data dashboard and alert management.
Understanding real time bridge monitoring sensors india deployments provides context for how dashboard data is generated and validated in field conditions.
Monitoring Priorities by Bridge Type
Not all bridges carry the same structural risk profile, and a monitoring plan must be calibrated to the structural form, span, material, and loading environment. The table below summarises monitoring priorities by bridge type relevant to India's highway and railway network.
| Bridge Type | Primary Monitoring Parameters | Key Sensors | Applicable IRC / IS Code | Typical Sampling Rate |
|---|---|---|---|---|
| Simply supported PSC girder | Mid-span deflection, girder strain, bearing movement | LVDT, VWSG, tiltmeter | IRC:112, IRC:6 | 1 Hz static; 200 Hz event |
| Continuous RC box girder | Hogging strain at piers, creep and shrinkage, temperature gradient | VWSG array, thermistors | IRC:112, IRC:78 | 1 Hz continuous |
| Cable-stayed bridge | Cable force, pylon tilt, deck acceleration, anchorage strain | Elasto-magnetic sensors, MEMS accelerometer, tiltmeter | IRC:114, IS 1893 | 100–1000 Hz dynamic |
| Extra-dosed bridge | Stay cable force, deck prestress, pylon rotation | Load cells, VWSG, tiltmeter | IRC:114 | 10 Hz continuous |
| Steel truss / arch bridge | Member strain, fatigue cycles, connection slip | VWSG, crack meter, displacement transducer | IRC:24, IS 800 | 200 Hz for fatigue |
| Railway bridge (open web girder) | Dynamic impact, rail-structure interaction, bearing settlement | MEMS accelerometer, LVDT, settlement sensor | IRS-B1, IS 1893 | 500–1000 Hz dynamic |
Cable-stayed and extra-dosed bridges present the most complex monitoring requirements because cable force redistribution under asymmetric loading or temperature change propagates stress changes throughout the entire structural system. Geolook's strategic advisor Sandeep Gupta, IRSE, brings direct operational experience from Indian Railways' long-span bridge portfolio to inform monitoring plan design for these bridge types.
For a process-level understanding of how monitoring data flows from sensor to decision, read how does bridge health monitoring work for national highways in india.
Regulatory and Compliance Framework in India
Bridge structural monitoring in India sits at the intersection of several regulatory instruments. IRC SP-35 provides the foundational inspection and maintenance framework. IRC SP-37 addresses guidelines for evaluation of load carrying capacity of bridges. IRC:6 defines design loads — dead load, live load, impact, wind, seismic, and temperature — against which monitoring thresholds are calibrated. IRC:114 covers cable-stayed bridges specifically, including requirements for stay cable inspection and force monitoring. IS 1893 Part 1 and Part 3 govern seismic design and, by extension, the seismic monitoring requirements for bridges in zones III–V.
NHAI's Standard Bidding Documents for highway projects increasingly include provisions for permanent SHM systems on bridges with spans exceeding 60 metres or located in seismic zones III and above. RVNL and Indian Railways reference IRS-B1 and the Bridge Rules for railway bridge monitoring. The Dam Safety Act 2021, while focused on dams, has set a precedent for mandatory instrumentation of critical infrastructure that is influencing bridge policy discussions at MoRTH.
State PWDs and urban development authorities are also beginning to specify bridge monitoring systems for flyovers and elevated corridors in metro cities, driven partly by incidents like the Vivekananda flyover collapse in Kolkata (2016) and the Gokhale Bridge closure in Mumbai (2018). Compliance with these emerging mandates requires a monitoring system that generates audit-ready data logs — timestamped, sensor-identified, and exportable in formats acceptable to government clients.
See the full range of Geolook transport infrastructure monitoring solutions for highways and railways to understand how compliance requirements are addressed across project types.
Deployment Workflow: From Site Survey to Live Dashboard
A bridge structural monitoring deployment follows a structured workflow that begins well before the first sensor is installed. The stages below represent engineering best practice for a permanent SHM bridge system:
- Structural review and monitoring plan: Review as-built drawings, design reports, and any prior inspection records. Identify critical sections, define monitoring parameters, and specify alert/alarm/action thresholds. Output: a formal Structural Monitoring Plan document.
- Sensor schedule and layout drawing: Prepare sensor location drawings showing exact installation positions, cable routing, and junction box locations. Coordinate with the bridge owner and traffic management authority for access and lane closure requirements.
- Procurement and factory acceptance testing (FAT): All sensors, DAQ units, and communication hardware are tested against specification before dispatch. Vibrating wire sensors are checked for frequency range and gauge factor; accelerometers are verified for sensitivity (typically 1000 mV/g for low-level vibration) and noise floor.
- Installation and commissioning: Sensors are installed per the layout drawing. VWSGs embedded in concrete are protected with epoxy-coated conduit. Surface-mounted sensors use stainless steel brackets. All cable connections are waterproofed to IP67 minimum. DAQ units are powered and communication links verified.
- Baseline data collection: A minimum 30-day baseline period captures the structure's response under normal traffic and temperature cycles. Baseline statistics define the normal operating envelope against which future anomalies are detected.
- Dashboard configuration and handover: Alert thresholds are programmed into the monitoring software. User accounts are created for the bridge owner, structural consultant, and maintenance team. A training session covers dashboard navigation, alert response protocols, and data export procedures.
- Ongoing monitoring and periodic reporting: Monthly and annual condition reports are generated from dashboard data. Threshold values are reviewed annually or after any significant event (flood, seismic, overload incident).
For real-time remote monitoring capabilities that extend across bridge and dam portfolios, see real time remote monitoring platform for bridges and dams.
Frequently Asked Questions
Q: What is a bridge structural monitoring system and what does it measure?
A: A bridge structural monitoring system is a permanently installed network of sensors, data acquisition units, and software that continuously measures physical parameters — including strain (micro-strain), deflection (mm), acceleration (mm/s²), tilt (degrees), crack width (mm), and temperature (°C) — to assess a bridge's structural condition in real time. It supplements periodic visual inspection under IRC SP-35 with continuous, quantitative data.
Q: Which Indian Standard codes govern bridge structural monitoring?
A: Bridge structural monitoring in India is governed primarily by IRC SP-35 for inspection and maintenance, IRC SP-37 for load capacity evaluation, IRC:6 for design loads used as threshold references, IRC:112 for concrete bridge design, and IRC:114 for cable-stayed bridges. Seismic monitoring requirements reference IS 1893. NHAI and RVNL project specifications may impose additional requirements beyond these codes.
Q: How is a bridge data dashboard different from a SCADA system?
A: A bridge data dashboard is a structural health monitoring interface purpose-built for civil engineering parameters — strain trends, deflection envelopes, frequency shifts, and condition-state indicators — with alert logic tied to IRC and IS code thresholds. A SCADA system is a general industrial control platform not optimised for structural time-series analysis, modal identification, or the audit-ready reporting formats required by NHAI and state PWDs.
Q: What is the typical sensor count for a medium-span highway bridge SHM system?
A: A medium-span highway bridge (40–80 m span) typically requires 20–60 sensors depending on structural complexity, including vibrating wire strain gauges at critical sections, LVDTs at mid-span and bearings, MEMS accelerometers for dynamic response, tiltmeters at piers, and crack meters at identified defect locations. The exact count is determined by the structural monitoring plan, which references design drawings and IRC:6 load cases.
Q: Can wireless DAQ systems match the data quality of wired systems for bridge monitoring?
A: Wireless DAQ systems can match wired systems for static and quasi-static parameters — strain, displacement, tilt, and temperature — where sampling rates below 10 Hz are sufficient. For high-frequency dynamic channels requiring 200–1000 Hz sampling, such as seismic response or fatigue monitoring on cable-stayed bridges, wired or fibre-optic connections remain the preferred choice to avoid packet loss and latency artefacts that corrupt modal analysis results.
Request bridge proposal
Geolook engineers have delivered bridge structural monitoring instrumentation and digital twin platforms for clients including IIT-Mandi, RITES Ltd, and Neeladari Buildtech, across bridge types ranging from highway girder bridges to cable-stayed structures. Whether your project requires a sensor-only supply, a full turnkey SHM bridge system, or a bridge data dashboard integrated with a 3D digital twin, our team can prepare a project-specific proposal aligned with IRC SP-35, IRC:114, and NHAI or RVNL specification requirements.
Submit your bridge details — span, structural type, seismic zone, and monitoring objective — and receive a structured technical proposal within five working days.
Contact Geolook to request a bridge structural monitoring proposal for your project