Web Data Monitoring System: Cloud Dashboards for Infrastructure Safety
In August 2018, the Majerhat bridge in Kolkata collapsed without warning, killing three people and injuring dozens — a structure that had been flagged in inspection reports but lacked any continuous, real-time monitoring. The absence of a live data pipeline between the structure and the engineers responsible for it was not a technology gap; it was a governance gap that technology can now close. A web data monitoring system (WDMS) is the software layer that converts raw sensor telemetry from embedded instruments into actionable engineering intelligence, accessible from any browser, at any time, from any location.
For project managers overseeing multi-site infrastructure portfolios and structural engineers interpreting micro-strain, pore pressure, and displacement data across dozens of sensors, the shift from periodic manual readings to a cloud-hosted, always-on web data monitoring system is not incremental — it is categorical. This post walks through what a WDMS dashboard actually does, how it is structured, what it displays, and why its architecture matters for compliance with Indian regulatory frameworks including MORTH guidelines, the Dam Safety Act 2021, and IRC SP-35.
Key Takeaways
- A web data monitoring system centralises multi-sensor SHM data on a cloud dashboard accessible in real time, eliminating the latency of manual data collection cycles.
- Automated threshold-based alerts — configurable in engineering units such as mm, kPa, or micro-strain — reduce response time from days to minutes when a parameter exceeds a safe limit.
- WDMS platforms support multi-project views, enabling a single engineer or project manager to monitor bridge, tunnel, and building sites simultaneously from one interface.
- Structured data exports from a WDMS are directly compatible with compliance reporting requirements under MORTH, CWC, and IRC frameworks.
- Digital twin integration, as demonstrated in Geolook's RITES 3D Digital Twin and VR Visualization Platform for Bridge Health Monitoring System, extends WDMS capability into spatial, model-linked visualization.
What Is a Web Data Monitoring System?
A web data monitoring system is a cloud-hosted software platform that ingests, processes, stores, and visualises structural and geotechnical sensor data in real time through a standard web browser interface, without requiring locally installed client software. The definition is precise: the system must operate over the internet or a secured intranet, must present data in engineering units, and must support configurable alarm thresholds tied to limit states defined by the design engineer.
In the context of structural health monitoring software, a WDMS sits at the top of the data acquisition stack. Below it are the sensors — vibrating wire strain gauges, MEMS accelerometers, piezometers, crackmeter, inclinometers — and the dataloggers that digitise and transmit their signals. The WDMS receives that transmitted data, applies calibration coefficients, converts raw counts to physical units, and renders the result on a dashboard that a geotechnical engineer in Delhi can read while the sensor is embedded in a tunnel lining in Ramban, Jammu and Kashmir.
This is not a passive display. A well-engineered WDMS applies rule-based and, increasingly, model-based logic to flag anomalies, generate reports, and trigger notifications via SMS or email when readings approach or breach threshold values set in accordance with the project's instrumentation and monitoring plan.
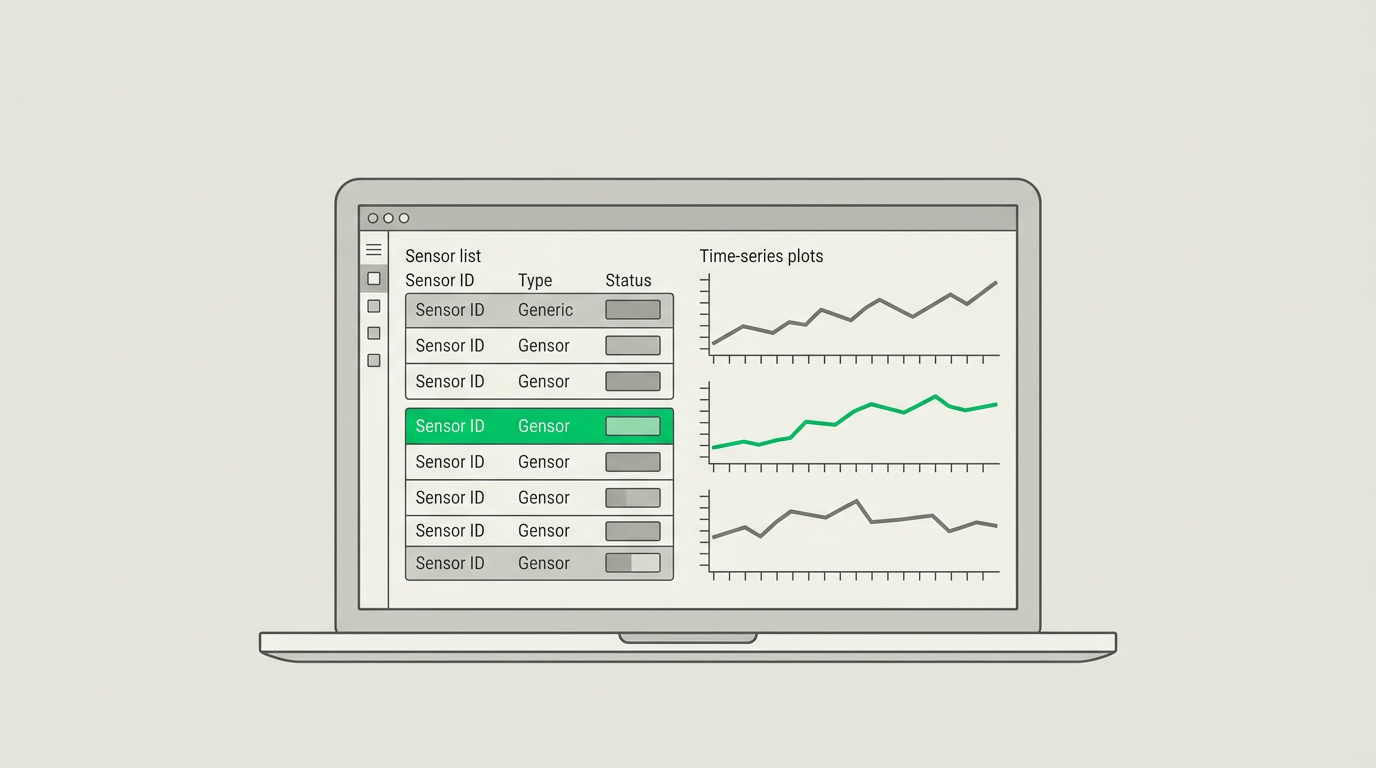
Dashboard Architecture: What Engineers Actually See
The dashboard is the human interface of the entire SHM data chain. Its architecture determines whether an engineer can make a decision in two minutes or two hours. A production-grade WDMS dashboard is typically organised into four functional layers.
Layer 1 — Project Overview Map: A GIS-anchored map view showing all monitored assets. Each asset is represented by a status indicator — green, amber, or red — based on the current worst-case reading across all sensors at that site. For a project manager overseeing five bridge sites and two tunnel corridors simultaneously, this layer answers the first question: is anything wrong right now?
Layer 2 — Sensor Group View: Drilling into a single asset reveals a grouped sensor panel. Sensors are organised by type — strain, displacement, vibration, temperature, pore pressure — and by structural zone. Each sensor tile shows the current reading in its engineering unit (e.g., 847 micro-strain, 12.4 kPa, −3.2 mm settlement), the timestamp of the last transmission, and a colour-coded status against the defined threshold bands.
Layer 3 — Time-Series Charts: Selecting any sensor opens a time-series plot. The engineer can zoom to any time window, overlay multiple sensors, and toggle between raw and processed data. For a vibrating wire piezometer embedded in a dam embankment, this chart might show pore pressure in kPa over a monsoon season, with the design threshold drawn as a horizontal reference line. Exceedances are automatically highlighted.
Layer 4 — Report and Export Module: Automated daily, weekly, or monthly PDF reports can be scheduled and emailed to designated recipients. Raw data can be exported in CSV or JSON format for further analysis in MATLAB, Python, or spreadsheet tools. This layer is critical for compliance: MORTH's guidelines for bridge instrumentation require periodic submission of monitoring data to the authority, and a WDMS with a scheduled report function makes that submission systematic rather than ad hoc.
Geolook's RITES 3D Digital Twin and VR Visualization Platform for Bridge Health Monitoring System adds a fifth layer to this architecture: a spatially registered 3D model of the bridge in which sensor readings are mapped to their physical location on the structure. An engineer can click on a node in the 3D model and retrieve the live sensor reading at that point, the historical trend, and the proximity to the threshold. This is machine learning in structural health monitoring applied to spatial data — the model learns which sensor combinations precede anomalous states and surfaces those patterns proactively.
Real-Time Alerting and Threshold Configuration
The value of a web-based SHM platform is only as good as its alerting logic. Raw data streaming to a dashboard that nobody watches continuously is not monitoring — it is data storage. The alerting engine is what converts continuous data into continuous vigilance.
In a properly configured WDMS, each sensor has at least three threshold levels: a warning threshold (typically set at 70–80% of the design limit state), an alarm threshold (set at the design limit), and a critical threshold (set at the structural capacity boundary, beyond which immediate intervention is required). These values are entered by the design engineer during system commissioning and are stored in the platform against each sensor's unique identifier.
When a reading crosses the warning threshold, the system logs the event and sends an SMS and email to the designated site engineer. When the alarm threshold is crossed, the notification escalates to the project manager and the client's monitoring authority. When the critical threshold is breached, the system can trigger an automated escalation protocol — including, in some configurations, integration with site access control systems.
At the MIT-WPU Tunnel Health Monitoring and Digital Twin Excellence Centre in Pune — inaugurated by Hon'ble Minister Sh. Nitin Gadkari — Geolook's WDMS platform is used as a live demonstration environment where engineers and researchers can observe how threshold-based alerting behaves under simulated loading scenarios. This training application reinforces the point that alerting configuration is an engineering task, not a software task: the thresholds must be derived from the structural analysis, not set arbitrarily.
Multi-Site Monitoring and Role-Based Access
Large infrastructure programmes — a national highway corridor, a metro rail project, a dam safety programme — involve dozens of monitored assets spread across hundreds of kilometres. A WDMS monitoring platform must therefore support multi-site architectures with role-based access control (RBAC).
In a typical RBAC configuration, a site instrument technician has read access to their assigned site only. A structural engineer has read and annotation access to all sites within their project. A project manager has read access across all projects in their portfolio plus access to the report generation module. The client authority — NHAI, RVNL, CWC, or BRO — has a read-only view of the projects they have commissioned, with no access to other clients' data.
This architecture is not merely convenient; it is a data governance requirement. Infrastructure monitoring data for national highway tunnels and bridges is sensitive. The WDMS must enforce data segregation at the database level, not just at the UI level, to ensure that a user cannot access data outside their authorised scope even through direct API calls.
For engineers working on transport infrastructure monitoring across multiple NHAI or RVNL corridors, the multi-site dashboard view is operationally transformative. Instead of logging into five separate systems or waiting for five separate weekly reports, a single dashboard session surfaces the status of every monitored asset in the portfolio, ranked by severity of current readings.
WDMS Integration with Dataloggers and Sensor Networks
A cloud dashboard is only as reliable as the data pipeline feeding it. The integration between field dataloggers and the WDMS platform is therefore a critical engineering interface, not a peripheral IT concern.
Modern structural monitoring dataloggers transmit data to the WDMS via GPRS, 4G LTE, or Wi-Fi, using MQTT or HTTP/S protocols. The datalogger polls its connected sensors at a configured scan rate — which may range from 1 Hz for dynamic vibration monitoring to one reading per 15 minutes for slow-moving geotechnical parameters like pore pressure or settlement — and packages the readings into a timestamped data frame that is pushed to the WDMS server.
On the server side, the WDMS applies the sensor's calibration equation to convert the raw digital count to a physical unit. For a vibrating wire sensor, this involves applying the gauge factor (typically expressed in units of engineering parameter per digit²) and a temperature correction coefficient. For a MEMS accelerometer, it involves applying the sensitivity in mV/g and converting to mm/s² for comparison against IS 1893 vibration limits.
Data integrity is maintained through a local buffer in the datalogger: if the cellular connection drops, the datalogger stores readings locally and uploads the buffered data when connectivity is restored, ensuring no gaps in the time-series record. This is particularly important for tunnel monitoring in geologically complex corridors like the Ramban-Banihal NH-44 section in J&K, where Geolook has deployed real-time SHM across five tunnels in association with DRAIPL, with review meetings conducted with the NHAI Regional Office. Connectivity in such terrain is intermittent, and a WDMS without local buffering would produce unreliable records.
Monitoring Method Comparison: Manual vs. WDMS-Based Approaches
The following table compares conventional manual monitoring practice against a cloud-based web data monitoring system across parameters that matter to project managers and structural engineers making procurement decisions.
| Parameter | Manual / Periodic Monitoring | Web Data Monitoring System (WDMS) |
|---|---|---|
| Data collection frequency | Weekly or fortnightly site visits | Continuous; configurable from 1 Hz to 15-minute intervals |
| Time to detect threshold breach | Days to weeks (next scheduled visit) | Minutes (automated SMS/email alert on breach) |
| Data format | Handwritten field sheets, manual spreadsheet entry | Timestamped digital records in engineering units, stored in cloud database |
| Multi-site visibility | Requires separate site visits or separate reports per site | Single dashboard view across all monitored assets |
| Compliance reporting | Manual compilation; prone to transcription error | Automated scheduled PDF reports; exportable CSV for authority submission |
| Audit trail | Paper-based; difficult to verify or reconstruct | Immutable timestamped database records; full audit trail |
| Integration with digital twin | Not feasible | Native integration; sensor readings mapped to 3D model nodes |
Compliance, Data Governance, and Indian Regulatory Context
Infrastructure monitoring in India operates within a layered regulatory framework. For bridges on national highways, MORTH's guidelines and IRC SP-35 specify the instrumentation requirements and the frequency of data submission to the authority. For dams, the Dam Safety Act 2021 mandates continuous monitoring of critical parameters including pore pressure, seepage, and deformation, with data to be submitted to the National Dam Safety Authority (NDSA). For tunnels constructed under NATM, the NHAI and BRO require convergence and support pressure monitoring throughout the construction phase and for a defined period post-construction.
A web data monitoring system that is designed for Indian regulatory compliance must therefore support: configurable data retention periods (the Dam Safety Act implies long-term archival), structured report formats aligned with authority templates, role-based access for authority review, and data export in formats compatible with the authority's own systems.
Beyond regulatory compliance, data governance within a WDMS must address data ownership. In a project where the client is NHAI or CWC, the monitoring data is the property of the authority, not the monitoring contractor. The WDMS must enforce this through contractual access controls and, on project completion, must support a full data handover — including the complete time-series database, calibration records, and threshold configuration — to the authority's own systems.
For engineers seeking a deeper technical foundation, the post on what is structural health monitoring and why does it matter provides the underlying engineering framework within which WDMS platforms operate. For a broader view of software platforms available in the Indian market, the analysis of what is the best cloud based software platform for structural health monitoring in india provides a structured comparison.
Frequently Asked Questions
Q: What is a web data monitoring system in structural health monitoring?
A: A web data monitoring system is a cloud-hosted software platform that receives sensor data from field instruments, converts raw signals to engineering units, and presents the results on a browser-accessible dashboard with real-time alerting. It eliminates the need for locally installed software and enables remote access by engineers, project managers, and regulatory authorities from any location with internet connectivity.
Q: How does a WDMS monitoring platform handle data gaps caused by connectivity loss in remote sites?
A: A WDMS monitoring platform handles connectivity loss through local data buffering in the field datalogger. When the cellular or network connection is restored, the datalogger uploads the buffered readings with their original timestamps, ensuring a continuous, gap-free time-series record. This is essential for tunnel and bridge monitoring in remote corridors where network coverage is intermittent.
Q: What threshold levels should be configured in a web-based SHM dashboard?
A: A web-based SHM dashboard should be configured with at least three threshold levels per sensor: a warning level at approximately 70–80% of the design limit state, an alarm level at the design limit, and a critical level at the structural capacity boundary. These values must be derived from the structural analysis and the project's instrumentation and monitoring plan, not set arbitrarily by the software operator.
Q: Can a cloud dashboard support compliance reporting under Indian regulatory frameworks like the Dam Safety Act 2021?
A: A cloud dashboard can support compliance reporting under the Dam Safety Act 2021 and MORTH guidelines if it is configured with scheduled automated report generation, structured data export in authority-compatible formats, and role-based access for regulatory reviewers. The platform must also support long-term data archival and a full data handover mechanism on project completion, as required by the National Dam Safety Authority.
Q: How does a WDMS integrate with a digital twin platform for bridge or tunnel monitoring?
A: A WDMS integrates with a digital twin platform by mapping live sensor readings to their corresponding nodes in a 3D structural model, so that an engineer can click on any element of the model and retrieve the current reading, historical trend, and threshold status at that point. Geolook's RITES 3D Digital Twin and VR Visualization Platform for Bridge Health Monitoring System demonstrates this integration in a production environment.
See WDMS live demo
Geolook's web data monitoring system is deployed on live infrastructure projects across India — from the NH-44 tunnel corridor in Jammu and Kashmir to bridge health monitoring platforms for RITES and academic research centres at MIT-WPU. The platform is not a prototype; it is in production use by engineers and project managers who depend on it for daily operational decisions.
If you are evaluating a web data monitoring system for an upcoming bridge, tunnel, building, or dam project, the most efficient next step is a live demonstration against your specific sensor types, site topology, and reporting requirements. Our engineering team will walk you through the dashboard using real project data, configure a sample alert scenario, and show you the report output your authority will receive.
To schedule a demonstration or discuss your project's monitoring requirements, contact the Geolook engineering team directly. You can also explore the full remote infrastructure monitoring capability that underpins the WDMS platform, or review the structural health monitoring technical guide for the sensor and instrumentation context in which the software operates.