How Is a Dam Continuously Monitored for Structural Safety in India?
In August 2018, the Mullapperiyar Dam controversy in Kerala intensified public concern when the state government issued precautionary evacuation advisories for downstream populations — a reminder that India's 5,745 large dams (as classified by CWC) hold the lives and livelihoods of millions in their shadow. Understanding how is a dam continuously monitored for structural safety in India is no longer a question only engineers ask; it is one that district administrators, project developers, and community leaders must be able to answer. This explainer walks through the full process in plain language, from the sensors embedded in concrete to the dashboards that alert engineers before a crack becomes a crisis.
India's Dam Safety Act, 2021 made continuous dam monitoring a legal obligation for all specified dams, placing responsibility on dam owners to maintain instrumentation, conduct periodic inspections, and report to the National Dam Safety Authority (NDSA) and State Dam Safety Organisations (SDSOs). Non-compliance carries legal consequences. The Act, read alongside CWC guidelines and IS 7894 (the Indian Standard for stability analysis of gravity dams), forms the regulatory backbone of every modern dam safety monitoring system deployed in India today.
Key Takeaways
- The Dam Safety Act, 2021 legally mandates continuous instrumentation and monitoring for all specified dams in India, with oversight by NDSA and State Dam Safety Organisations.
- A complete dam safety system combines multiple sensor types — piezometers, seismographs, tiltmeters, weirs, and crack meters — each measuring a different physical parameter critical to structural integrity.
- Data from sensors is collected automatically by data acquisition units and transmitted to centralised dashboards, enabling engineers to detect anomalies in near real time.
- Pore water pressure, measured in kPa by vibrating wire piezometers, is one of the most critical parameters because excess uplift pressure is a leading cause of dam failure.
- Continuous dam monitoring does not replace periodic physical inspections; it supplements them with objective, time-stamped data that supports engineering decisions and regulatory reporting.
What Continuous Dam Monitoring Means
Continuous dam monitoring is the automated, uninterrupted measurement of a dam's physical parameters — including pore water pressure, seepage flow, structural deformation, and seismic acceleration — using permanently installed instruments that transmit data to a central system without requiring manual readings at each sensor location.
The word continuous is important. Traditional dam safety relied on manual readings taken by field staff at fixed intervals — weekly or monthly. A dam can develop dangerous pore water pressure or seepage changes within hours of a heavy rainfall event. Continuous systems sample sensors at intervals as short as 15 minutes or even 5 minutes during flood seasons, giving engineers the time to act. Under CWC guidelines, high-hazard dams are expected to have automated data acquisition systems (ADAS) that log readings without human intervention.
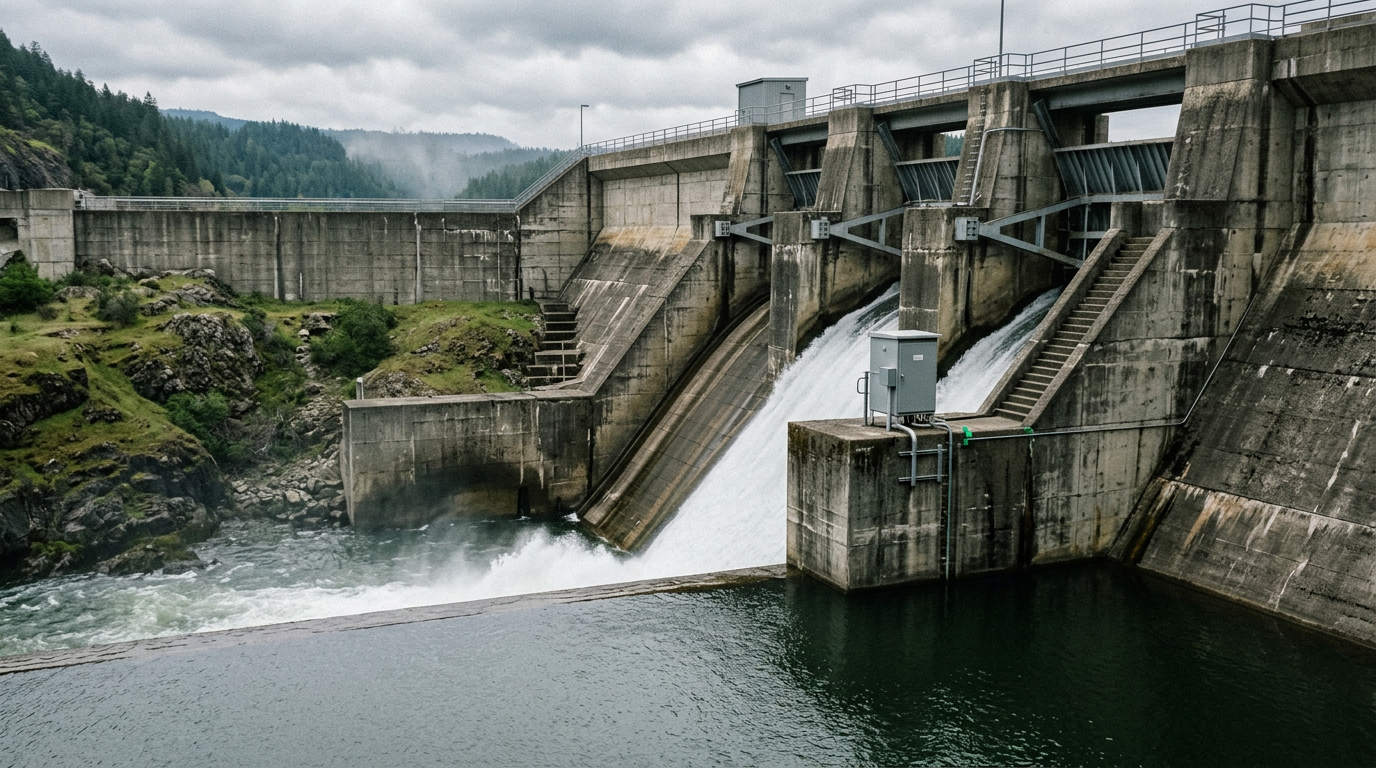
The Sensors That Watch a Dam Around the Clock
Every parameter that matters to a dam's structural health has a corresponding sensor. Here is what each one measures and why it matters:
- Vibrating Wire Piezometers: Installed inside the dam body and foundation, these instruments measure pore water pressure in kPa. Excess pore pressure reduces the effective stress in the dam's foundation, which can trigger sliding or piping failure. A vibrating wire piezometer works by measuring the resonant frequency of a tensioned wire — a change in pressure changes the frequency, which is converted to a pressure reading. IS 7894 and CWC instrumentation manuals both specify piezometer placement criteria for earthen and concrete dams.
- Seepage Measurement Weirs (V-notch or rectangular): Seepage through or under a dam is normal up to a threshold. A sudden increase in seepage volume — measured in litres per second — can indicate internal erosion or piping. V-notch weirs at the dam toe measure this flow continuously.
- Tiltmeters and Plumb Lines: These detect angular rotation or horizontal displacement of the dam body in millimetres or arc-seconds. A concrete gravity dam that begins to tilt toward the downstream face is exhibiting a warning sign that demands immediate investigation.
- Strong Motion Accelerographs (Seismographs): India sits in seismic zones II through V as per IS 1893. Dams in zones III, IV, and V must record ground acceleration in mm/s² during seismic events. This data is used to assess whether a seismic event has caused structural damage that is not visible to the naked eye.
- Crack Meters and Joint Meters: Installed across existing cracks or construction joints, these measure opening or closing in millimetres. A crack that widens by more than a threshold value between readings triggers an alert.
- Total Station and GNSS Survey Points: For large dams, geodetic monitoring using robotic total stations or GNSS receivers tracks absolute displacement of the dam crest and abutments in three dimensions, with accuracy to sub-millimetre levels.
For a deeper technical look at one of the most critical instruments in this network, see our guide on real time pore water pressure monitoring in dams.
How Data Flows from Sensor to Engineer: The Process
Understanding the data flow helps non-technical stakeholders appreciate why a modern dam safety system is more than a collection of instruments. The process has five distinct stages:
- Sensing: Instruments embedded in the dam body, foundation, and abutments convert physical phenomena — pressure, displacement, temperature, acceleration — into electrical signals. Vibrating wire sensors output a frequency in Hz; strain gauges output resistance in ohms; accelerographs output voltage proportional to acceleration in mm/s².
- Signal Conditioning and Local Acquisition: A data acquisition unit (DAU) or data logger installed in a field enclosure near the sensor cluster reads the raw electrical signal, applies calibration factors, and converts it to engineering units (kPa, mm, mm/s²). Modern DAUs can multiplex dozens of sensor channels.
- Transmission: Processed data is transmitted from the DAU to a central server using GSM/4G cellular networks, optical fibre, or satellite links — depending on the dam's location and connectivity. Remote dams in Himalayan or northeastern India often rely on VSAT or satellite modems.
- Central Database and SCADA/Dashboard: Data arrives at a central server where it is stored in a time-series database. A SCADA or web-based dashboard displays current readings, historical trends, and threshold exceedance alerts. Engineers can view the status of every sensor from any location.
- Alert and Response: When a reading crosses a pre-defined threshold — for example, pore water pressure exceeding a design limit, or seepage flow doubling within 24 hours — the system sends automated alerts via SMS or email to designated engineers and dam safety officers. The engineer then decides whether to escalate to the SDSO or initiate emergency protocols.
This five-stage process is what transforms isolated sensor readings into an actionable dam safety system. For a broader overview of how these elements combine in practice, the dam safety monitoring guide covers instrumentation planning, threshold setting, and regulatory reporting in detail.
Sensor Technologies Compared: Choosing the Right Instrument
Not all sensors are equal in performance, longevity, or suitability for dam environments. The table below compares the principal sensor technologies used in continuous dam monitoring across parameters that matter to project owners and dam safety engineers.
| Parameter | Sensor Type | Measurement Range (Typical) | Output Signal | Suitability for Submerged / Embedded Use | Relevant Standard / Guideline |
|---|---|---|---|---|---|
| Pore water pressure | Vibrating wire piezometer | 0–700 kPa (varies by range) | Frequency (Hz) | Excellent — designed for permanent embedment | CWC Instrumentation Manual; IS 7894 |
| Pore water pressure | Pneumatic piezometer | 0–700 kPa | Pneumatic pressure | Good — requires tubing to surface readout | CWC Instrumentation Manual |
| Seepage flow | V-notch / rectangular weir with level sensor | 0.01–500 L/s | Water level (mm) converted to flow | Surface installation at dam toe | CWC guidelines |
| Structural tilt / rotation | Electrolytic tiltmeter | ±15° or ±30° arc | Voltage (mV) | Good — sealed units available | IS 7894; CWC guidelines |
| Crack / joint movement | Vibrating wire crack meter | 0–50 mm or 0–100 mm | Frequency (Hz) | Good — weatherproof housing required | IS 7894 |
| Seismic acceleration | Strong motion accelerograph | ±2g full scale | Digital (acceleration in mm/s²) | Surface / gallery mounting | IS 1893; NDMA guidelines |
| Absolute displacement | GNSS / robotic total station | Sub-mm to mm accuracy | Digital coordinates | Surface prism / antenna on dam crest | CWC guidelines; Survey of India protocols |
Vibrating wire technology dominates dam monitoring in India because its frequency-based output is immune to long cable resistance changes — a critical advantage when sensor cables run hundreds of metres through a dam body. For a technical comparison of vibrating wire and MEMS sensor technologies, see our post on how do vibrating wire strain gauges compare to mems sensors for dam monitoring in india.
The Role of the Dam Safety Act, 2021 and CWC in Mandating Monitoring
India's Dam Safety Act, 2021 is the first national legislation specifically governing dam safety. Before its enactment, dam safety was governed by state-level policies that varied widely in rigour. The Act established the National Dam Safety Authority (NDSA) as the apex regulatory body and required every state to constitute a State Dam Safety Organisation (SDSO). It classifies dams by hazard potential — high, medium, and low — and mandates that high-hazard dams have comprehensive instrumentation and automated monitoring.
Under the Act, dam owners must submit annual inspection reports and emergency action plans (EAPs). The EAP must specify the trigger levels — expressed as actual measured values such as reservoir level in metres above mean sea level, seepage flow in L/s, or pore water pressure in kPa — at which downstream evacuation is initiated. Continuous monitoring data is the evidence base for these trigger levels. Without automated, time-stamped sensor data, an EAP is a document without a nervous system.
CWC's Guidelines for Instrumentation of Dams specifies the minimum instrumentation requirements by dam type and height. For earthen dams above 30 metres, for example, piezometers must be installed at multiple cross-sections, and seepage measurement at the toe is mandatory. These guidelines are the practical engineering translation of the Act's legal requirements.
What Happens When a Threshold Is Breached
A threshold breach does not automatically mean a dam is about to fail. It means a pre-agreed engineering limit has been crossed and a defined response must follow. Dam safety engineers typically set three alert levels:
- Level 1 — Attention: A reading has moved outside the normal operating range. The dam safety officer is notified and increases monitoring frequency. No public action is required.
- Level 2 — Alert: A reading has reached a value that indicates potential structural concern. Senior engineers review the data, a site inspection is conducted within 24 hours, and the SDSO is informed. Downstream communities may be placed on standby.
- Level 3 — Emergency: A reading indicates imminent risk to the dam's structural integrity. The Emergency Action Plan is activated, downstream evacuation is initiated, and NDSA is notified. The dam's spillway gates may be opened to reduce reservoir level.
This tiered response structure is only possible when continuous dam monitoring provides real-time data. A manual reading system — where a field technician visits each instrument once a week — cannot detect the rapid changes that precede a dam failure event. The 2021 Chamoli disaster in Uttarakhand, while a glacial lake outburst rather than a dam failure, demonstrated how quickly water-related infrastructure events can escalate in Himalayan terrain, reinforcing the case for automated, always-on monitoring systems.
Integrating Monitoring Data with Dam Operations
A dam is not a static structure. Reservoir levels rise and fall with monsoon inflows and controlled releases. Each change in reservoir level changes the hydrostatic load on the dam body, which in turn changes pore water pressures, seepage rates, and structural stresses. A well-designed continuous dam monitoring system integrates sensor data with operational data — reservoir level in metres, gate positions, inflow and outflow in cumecs — so that engineers can correlate structural behaviour with operational conditions.
This integration enables what engineers call behavioural analysis: comparing the dam's current measured response to its historical response under similar loading conditions. If pore water pressure at a given piezometer is 15 kPa higher than it was during the same reservoir level three years ago, that divergence from historical behaviour is a signal worth investigating, even if the absolute value has not crossed a threshold. Modern SCADA dashboards and data analytics platforms make this kind of trend analysis accessible without requiring the operator to manually process spreadsheets.
Explore the full range of applications for dam and hydropower infrastructure monitoring on the energy infrastructure monitoring solutions page.
Frequently Asked Questions
Q: How is a dam continuously monitored for structural safety in India under the Dam Safety Act, 2021?
A: Continuous dam monitoring in India is legally mandated by the Dam Safety Act, 2021, which requires dam owners to install and maintain instrumentation systems that automatically record parameters such as pore water pressure in kPa, seepage flow in L/s, and structural displacement in mm. Data is transmitted to a central dashboard and reviewed by engineers and State Dam Safety Organisations to detect anomalies before they become emergencies.
Q: What sensors are used in a dam safety system?
A: A dam safety system typically uses vibrating wire piezometers for pore water pressure, V-notch weirs for seepage flow, tiltmeters for structural rotation, crack meters for joint movement, strong motion accelerographs for seismic acceleration in mm/s², and GNSS or total station prisms for absolute displacement. Each sensor targets a specific failure mode identified in CWC guidelines and IS 7894.
Q: Why is pore water pressure the most critical parameter in dam monitoring?
A: Pore water pressure, measured in kPa by vibrating wire piezometers, is critical because excess uplift pressure in the dam foundation reduces effective stress and can trigger sliding, piping, or overturning failure. IS 7894 and CWC instrumentation guidelines both prioritise piezometer placement at multiple cross-sections because pore pressure changes are often the earliest measurable indicator of internal distress in earthen and concrete dams.
Q: How often does a continuous dam monitoring system record data?
A: A continuous dam monitoring system typically records sensor readings at intervals of 15 to 60 minutes during normal conditions, and can be configured to increase to 5-minute intervals during flood events or when reservoir levels rise rapidly. Automated data acquisition units log readings without human intervention and transmit them to a central server, ensuring no critical changes are missed between manual inspection visits.
Q: What is the difference between continuous monitoring and periodic inspection for dam safety?
A: Continuous dam monitoring uses permanently installed sensors and automated data loggers to record physical parameters around the clock, while periodic inspection involves trained engineers physically examining the dam structure at scheduled intervals — typically annually or after significant events. The two approaches are complementary: continuous monitoring provides objective, time-stamped data between inspections, and inspections provide visual and qualitative assessment that sensors cannot replicate. Both are required under the Dam Safety Act, 2021.
See dam monitoring demo
Dam safety is not a passive obligation — it is an active, data-driven engineering discipline. Whether you are a dam owner navigating compliance with the Dam Safety Act, 2021, a state government engineer responsible for high-hazard dam oversight, or a project developer planning instrumentation for a new hydropower facility, the right monitoring architecture makes the difference between early warning and emergency response.
Geolook designs and deploys continuous dam monitoring systems that integrate vibrating wire piezometers, seepage measurement, tiltmeters, seismic sensors, and centralised SCADA dashboards — engineered to meet CWC guidelines and IS 7894 requirements. To understand how a complete instrumentation plan is structured for your dam type and hazard classification, visit the vibrating wire piezometer working principle guide, or contact Geolook's dam safety engineering team to discuss your project requirements and request a live system demonstration.