How Does Bridge Health Monitoring Work for National Highways in India?
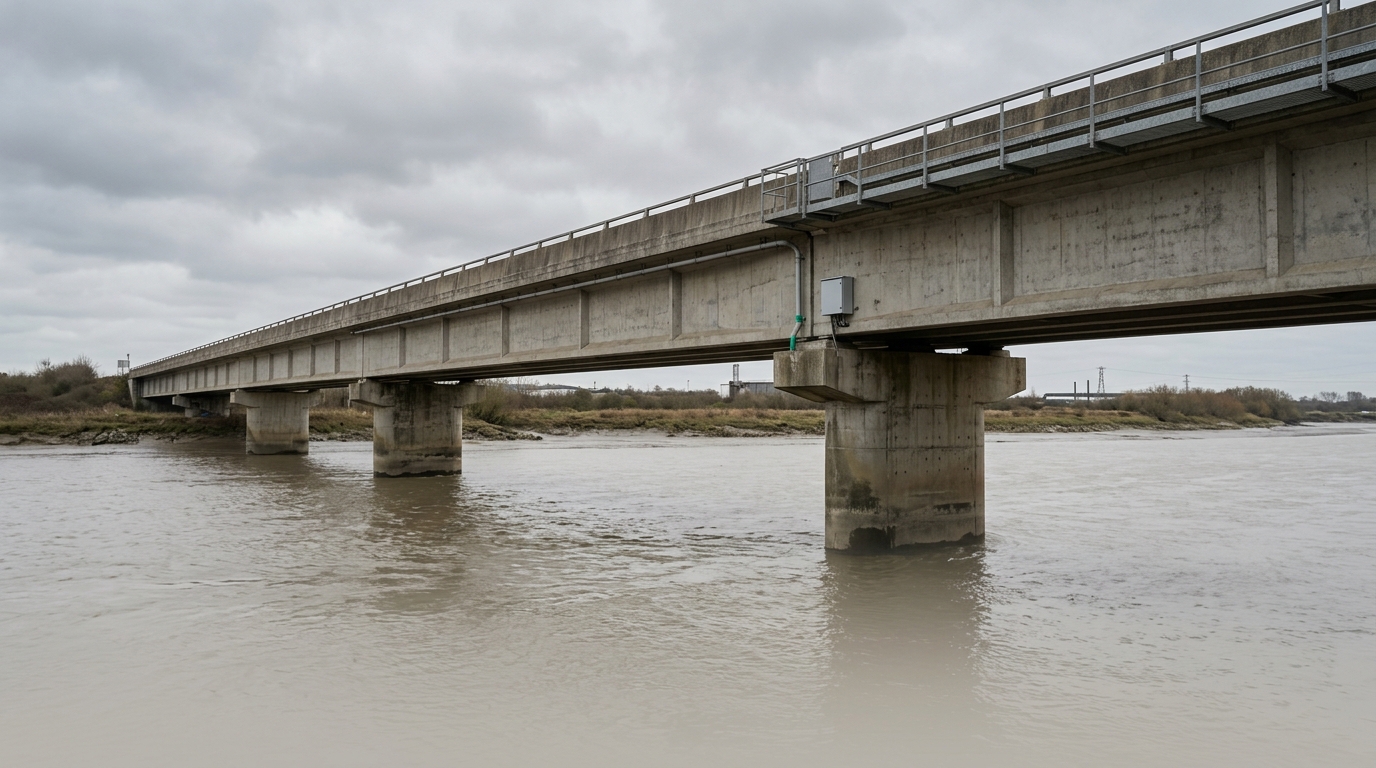
In August 2016, the Majerhat Bridge in Kolkata showed visible distress signs for months before a section collapsed, killing three people and disrupting a critical urban corridor. The incident prompted the Ministry of Road Transport and Highways (MoRTH) to accelerate the rollout of the Integrated Bridge Management System (IBMS) — a national-level framework mandating systematic inspection and, increasingly, continuous electronic monitoring of bridges on national highways. Understanding how bridge health monitoring works for national highways in India is no longer an academic question; it is a procurement and compliance imperative for every agency and EPC involved in highway infrastructure.
This explainer walks non-technical decision-makers through the end-to-end bridge monitoring process — from the first sensor bolt to the dashboard alert — using the standards, agencies, and project contexts that govern Indian national highway practice.
Key Takeaways
- Bridge health monitoring on Indian national highways combines permanently installed sensors, wireless or wired data acquisition units, and cloud-based dashboards to track structural behaviour in real time.
- MoRTH's IBMS framework and IRC SP-35 provide the regulatory baseline for inspection and monitoring obligations on NH corridors.
- Sensor outputs — strain in micro-strain, deflection in millimetres, acceleration in mm/s², crack width in mm — feed automated alert thresholds that trigger engineer review before a defect becomes a failure.
- 3D digital twin platforms, such as the one developed by RITES Ltd in collaboration with Geolook, allow bridge owners to visualise sensor data spatially against the bridge model, dramatically reducing the time from data to decision.
- Wireless data acquisition systems, as deployed by Neeladari Buildtech for bridge health monitoring, reduce installation disruption on live traffic corridors where cabling is impractical.
What Bridge Health Monitoring Actually Means
Bridge health monitoring is the continuous or periodic automated measurement of a bridge's structural response — strain, deflection, vibration, crack width, temperature, and tilt — using permanently installed sensors and data acquisition hardware, with the data transmitted to a central platform for analysis and alert generation.
This definition matters because it distinguishes monitoring from inspection. Visual inspection under IRC SP-35 is periodic and observer-dependent. Monitoring is continuous, instrument-dependent, and produces time-series data that can be interrogated statistically. The two are complementary: inspection identifies visible surface defects; monitoring captures sub-surface and dynamic behaviour that no inspector can see from a walkway.
For national highway bridges, the relevant standards include IRC SP-35 (Guidelines for Inspection and Maintenance of Bridges), IRC:6 (Loads and Stresses), IRC:112 (Concrete Bridge Code), and IRC:114 (Seismic Design of Bridges). IS 1893 Part 3 governs seismic demand on bridge structures. Together, these codes define the load cases and limit states that a monitoring system must be designed to detect exceedances of.
Explore the full range of bridge structural health monitoring systems and sensor packages that Geolook deploys on national highway corridors.
Step-by-Step: How the Bridge Monitoring Process Works
- Structural Assessment and Sensor Placement Design. Before a single sensor is installed, a structural engineer reviews the bridge drawings, load history, and any existing inspection reports. Critical sections are identified — typically mid-span, quarter-span, pier tops, bearing zones, and expansion joints. For cable-stayed or extra-dosed bridges, stay-cable anchor zones and pylon bases are priority locations. Geolook's strategic advisor Sandeep Gupta, IRSE, former Chief Administrative Officer of Indian Railways, brings specific domain expertise in cable-stayed and extra-dosed bridge engineering to this design phase, ensuring sensor placement reflects actual structural behaviour rather than generic templates.
- Sensor Installation. Sensors are surface-mounted or embedded depending on bridge age and access. Common sensor types include vibrating-wire strain gauges (measuring in micro-strain, typically ±3000 µε range), MEMS accelerometers (measuring in mm/s² or g), linear variable differential transformers (LVDTs) for deflection in millimetres, tiltmeters for rotation in millidegrees, crack meters for crack width in mm, and thermistors for temperature compensation. IIT-Mandi's bridge health monitoring programme, for which Geolook supplied accessories, demonstrates how academic-grade sensor selection translates directly into reliable long-term data on mountain-region bridges subject to high seismic and thermal loading.
- Data Acquisition Unit (DAQ) Installation. Sensors connect to a DAQ, which conditions the analogue signal, digitises it, timestamps it, and packages it for transmission. On live traffic bridges where running cables across carriageways is impractical, wireless DAQ units are preferred. Neeladari Buildtech's wireless DAQ deployment for a bridge health monitoring system illustrates how wireless architecture eliminates the need for conduit trenching across active lanes, reducing installation time and traffic disruption significantly.
- Communication and Data Transmission. The DAQ transmits data over GSM/4G, fibre, or licensed radio to a central server. Transmission intervals are configurable — typically every 1 to 10 minutes for quasi-static parameters like strain and tilt, and at 100–200 Hz sampling rates for dynamic parameters like acceleration during vehicle crossing events. Redundant communication paths are specified for critical NH bridges to ensure data continuity during network outages.
- Central Platform Ingestion and Storage. Incoming data streams are ingested into a time-series database. Raw sensor readings are converted to engineering units — volts to micro-strain, frequency to kPa, counts to mm — using calibration coefficients stored against each sensor's unique ID. Data integrity checks flag dropouts, drift, and out-of-range readings automatically. Learn how Geolook's SHM software platform manages multi-bridge data ingestion and storage for highway asset owners.
- Threshold-Based Alerting and Anomaly Detection. Engineers pre-set alert thresholds based on design limit states. For example, a mid-span deflection exceeding L/600 (where L is span length in metres, per IRC:112 serviceability criteria) triggers a Level 1 alert sent by SMS and email. A second threshold at L/400 triggers a Level 2 alert requiring immediate inspection. Acceleration thresholds tied to IS 1893 seismic zones can trigger post-earthquake automated scans. The system logs every threshold exceedance with timestamp, sensor ID, and measured value.
- 3D Digital Twin Visualisation. Advanced deployments overlay sensor data onto a georeferenced 3D model of the bridge. RITES Ltd, in collaboration with Geolook, developed a 3D Digital Twin and VR Visualisation Platform specifically for bridge health monitoring systems, enabling bridge owners and NHAI regional offices to view real-time sensor readings spatially — colour-coded by severity — against the actual bridge geometry. This transforms raw numbers into actionable spatial intelligence that non-technical stakeholders can interpret directly.
- Reporting and IBMS Integration. Monitoring data feeds into MoRTH's Integrated Bridge Management System (IBMS), which maintains a national inventory of bridge condition ratings. Automated monthly and quarterly reports are generated from the monitoring platform, pre-formatted for IBMS upload. This closes the loop between continuous electronic monitoring and the national inspection regime, satisfying both the data-collection mandate and the audit trail requirement for NH asset management.
- Periodic Review and Recalibration. Sensors drift over time. Annual recalibration against reference standards, combined with periodic site visits to check mounting integrity, ensures data quality over the bridge's service life. Calibration records are stored in the platform against each sensor's lifecycle log, providing the documentary evidence required for IRC SP-35 compliance audits.
For a deeper look at the sensor technologies used in each of these steps, read our guide on what sensors are used for real time structural monitoring of bridges in India.
Sensor Types and What They Measure: A Comparison
The following table summarises the principal sensor types used in bridge health monitoring on Indian national highways, the physical parameter each measures, typical measurement range, and the structural behaviour each is designed to detect.
| Sensor Type | Parameter Measured | Typical Range / Resolution | Structural Behaviour Detected | Relevant IRC / IS Reference |
|---|---|---|---|---|
| Vibrating-Wire Strain Gauge | Strain in structural members | ±3000 µε / 1 µε | Overloading, fatigue accumulation, section loss | IRC:112, IRC:6 |
| MEMS Accelerometer | Vibration / dynamic response | ±2g / 0.001g at 200 Hz | Natural frequency shift, impact loading, seismic event | IS 1893 Part 3, IRC:114 |
| LVDT / Displacement Transducer | Deflection in mm | 0–100 mm / 0.01 mm | Excessive mid-span sag, bearing movement, settlement | IRC:112 (L/600 serviceability) |
| Tiltmeter | Rotation in millidegrees | ±15° / 0.001° | Pier lean, abutment rotation, foundation movement | IRC:78, IS 1892 |
| Crack Meter | Crack width in mm | 0–50 mm / 0.01 mm | Concrete cracking, joint opening, delamination | IRC:112 (crack width limits) |
| Thermistor / Thermocouple | Temperature in °C | −40 to +85 °C / 0.1 °C | Thermal gradient effects, temperature-corrected strain | IRC:6 (temperature load) |
| Load Cell | Force in kN | 0–5000 kN / 0.1 kN | Bearing load distribution, cable tension in stayed bridges | IRC:6, IRC SP-37 |
Real-Time Bridge Data in India: What the Dashboard Shows
Real-time bridge data in India, when properly structured, gives a highway asset manager three categories of information simultaneously: current structural state (are readings within normal bounds right now?), trend analysis (is any parameter drifting over weeks or months?), and event records (what happened during the last heavy vehicle crossing or the last rain event?).
A well-configured dashboard for an NH bridge will display live readings from every active sensor, colour-coded against threshold bands — green for normal, amber for watch, red for alert. Time-series plots allow engineers to correlate strain spikes with temperature changes, separating thermal expansion from genuine overload. Frequency-domain plots from accelerometer data reveal natural frequency, which is a sensitive indicator of stiffness loss: a measurable drop in the fundamental frequency of a bridge deck can indicate damage before any visible cracking appears.
For cable-stayed bridges — a bridge typology where Geolook advisor Sandeep Gupta, IRSE, brings specific long-span engineering expertise — stay-cable load cells and pylon tiltmeters feed into the same dashboard, giving operators a complete picture of force distribution across the entire structural system, not just the deck.
Understand how the monitoring platform integrates with broader transport infrastructure programmes by visiting Geolook's transport infrastructure monitoring solutions.
IBMS and Regulatory Context for NH Bridge Monitoring
MoRTH's Integrated Bridge Management System (IBMS) is the national database and workflow tool for managing India's approximately 1.5 lakh bridges on national and state highways. IBMS assigns a condition rating to each bridge based on inspection data, and increasingly, electronic monitoring data is being integrated into IBMS workflows to supplement periodic visual inspection.
Under IRC SP-35, bridges are classified by age, span, and traffic loading into inspection frequency categories. Bridges over 60 metres span, bridges in seismic zones III, IV, and V per IS 1893, and bridges carrying more than 50,000 PCUs per day are candidates for continuous electronic monitoring rather than periodic inspection alone. NHAI's standard data requirements for NH bridges specify that monitoring data must be archived for a minimum period and made available for third-party audit — requirements that a properly configured SHM platform satisfies automatically through its logging and export functions.
The Dam Safety Act 2021 analogy is instructive: just as that legislation mandated instrumentation for large dams, the trajectory of MoRTH policy is toward mandatory electronic monitoring for critical NH bridges. Agencies and EPCs that establish monitoring infrastructure now are building the institutional capability to comply with requirements that are already forming in policy.
For a broader perspective on why this matters structurally, read why is structural health monitoring important for bridges.
Wireless vs. Wired Data Acquisition: Choosing the Right Architecture
The choice between wired and wireless DAQ architecture is one of the first practical decisions in any bridge monitoring deployment, and it has direct consequences for installation cost, maintenance burden, and data reliability on live NH corridors.
Wired systems — typically using RS-485, SDI-12, or Modbus over shielded cable — offer the highest signal integrity and are preferred for long-term permanent installations where cable routing can be protected within the bridge structure. However, on existing bridges carrying live traffic, running cables across expansion joints, through bearings, and across carriageways requires lane closures and significant civil work.
Wireless systems, such as those deployed by Neeladari Buildtech for bridge health monitoring, use IEEE 802.15.4, LoRaWAN, or licensed 900 MHz radio to transmit sensor data from node to gateway without physical cable runs across the bridge deck. This is particularly valuable on NH bridges in difficult terrain — mountain passes, river crossings — where cable installation and maintenance access is constrained. The trade-off is battery management for node-powered sensors and potential radio interference in dense urban corridors, both of which are addressed through careful system design and site-specific radio frequency planning.
Many deployments use a hybrid architecture: wired connections within a pier or abutment cluster, with wireless hops between clusters and a wired or cellular backhaul to the central server.
Digital Twin Integration for Bridge Asset Management
A digital twin for bridge health monitoring is a georeferenced, parametric 3D model of the bridge that is linked to live sensor data, so that the model updates in real time to reflect the bridge's current measured condition. It is distinct from a BIM model, which is a static design record, and from a finite element model, which is a computational tool — though both can be incorporated into a digital twin framework.
RITES Ltd, in collaboration with Geolook, developed a 3D Digital Twin and VR Visualisation Platform for bridge health monitoring that demonstrates what this capability looks like in practice for a government PSU context. Bridge owners can navigate the 3D model, click on any sensor location, and see the live time-series reading alongside the design limit for that parameter. VR visualisation allows inspection teams to conduct virtual walkthroughs of the bridge model, reviewing sensor data spatially before committing to a physical site visit — a significant efficiency gain for bridges in remote or difficult-access locations.
The same digital twin framework was applied in the MIT-WPU Tunnel Health Monitoring and Digital Twin Excellence Centre in Pune, inaugurated by Hon'ble Minister Sh. Nitin Gadkari, establishing a replicable model for how digital twin platforms can serve both operational monitoring and training functions within a single infrastructure.
See how the software layer connects sensors to decisions by exploring bridge structural monitoring systems and data management.
Frequently Asked Questions
Q: How does bridge health monitoring work for national highways in India?
A: Bridge health monitoring for national highways in India works by permanently installing sensors — strain gauges, accelerometers, LVDTs, tiltmeters — at critical structural locations, connecting them to data acquisition units that transmit readings to a central platform, where automated thresholds trigger alerts and data feeds into MoRTH's IBMS for condition rating and compliance reporting.
Q: What is the IBMS and why does it matter for bridge monitoring?
A: The Integrated Bridge Management System (IBMS) is MoRTH's national database for managing bridge inventory, inspection records, and condition ratings across Indian national and state highways. It matters for bridge monitoring because electronic sensor data is increasingly integrated into IBMS workflows, providing continuous structural evidence to supplement periodic visual inspection under IRC SP-35 and supporting audit-ready asset management records.
Q: Which Indian Standard codes apply to bridge health monitoring?
A: The primary codes governing bridge health monitoring in India are IRC SP-35 for inspection and maintenance, IRC:6 for load standards, IRC:112 for concrete bridge design and serviceability limits, IRC:114 for seismic design, and IS 1893 Part 3 for seismic demand on bridge structures. These codes define the load cases and limit states that monitoring thresholds are calibrated against.
Q: What is the difference between wired and wireless DAQ for bridge monitoring?
A: Wired DAQ systems use shielded cable — RS-485 or Modbus — to transmit sensor signals with high integrity, and are preferred for permanent installations within protected bridge structures. Wireless DAQ systems use radio protocols such as LoRaWAN or IEEE 802.15.4 to eliminate cable runs across live carriageways, reducing installation disruption on active NH bridges where lane closures are operationally costly.
Q: How often is bridge monitoring data collected and reviewed?
A: Quasi-static parameters such as strain, tilt, and crack width are typically sampled every 1 to 10 minutes, while dynamic parameters such as acceleration are sampled at 100–200 Hz during vehicle crossing events. Automated threshold alerts are generated in real time, while trend analysis reports are produced monthly and quarterly for submission to bridge owners and NHAI regional offices.
See live bridge demo
Geolook's bridge health monitoring systems are deployed across national highway corridors, PSU programmes, and academic research projects — from wireless DAQ installations on live traffic bridges to 3D digital twin platforms for government asset owners. Whether you are evaluating monitoring for a new NH bridge, retrofitting an existing structure, or building IBMS-compliant reporting into your asset management programme, our engineering team can walk you through a live demonstration of the platform with real sensor data.
Explore the complete Geolook bridge health monitoring product range or contact our team directly to schedule a demonstration tailored to your bridge typology and NH corridor requirements.
Request a live bridge monitoring demonstration from Geolook's engineering team
You may also find these resources useful as you evaluate your monitoring requirements: our detailed guide on real time bridge monitoring sensors india and our overview of real time remote monitoring platform for bridges and dams.
Project inquiry
Talk to a Geolook™ specialist
Share your monitoring requirement and our team will help identify the right next step.
By submitting, you agree that Geolook™ may contact you about this inquiry. Your details are not added to a marketing list.