AI-Powered SHM Dashboard with Automated Alerts India
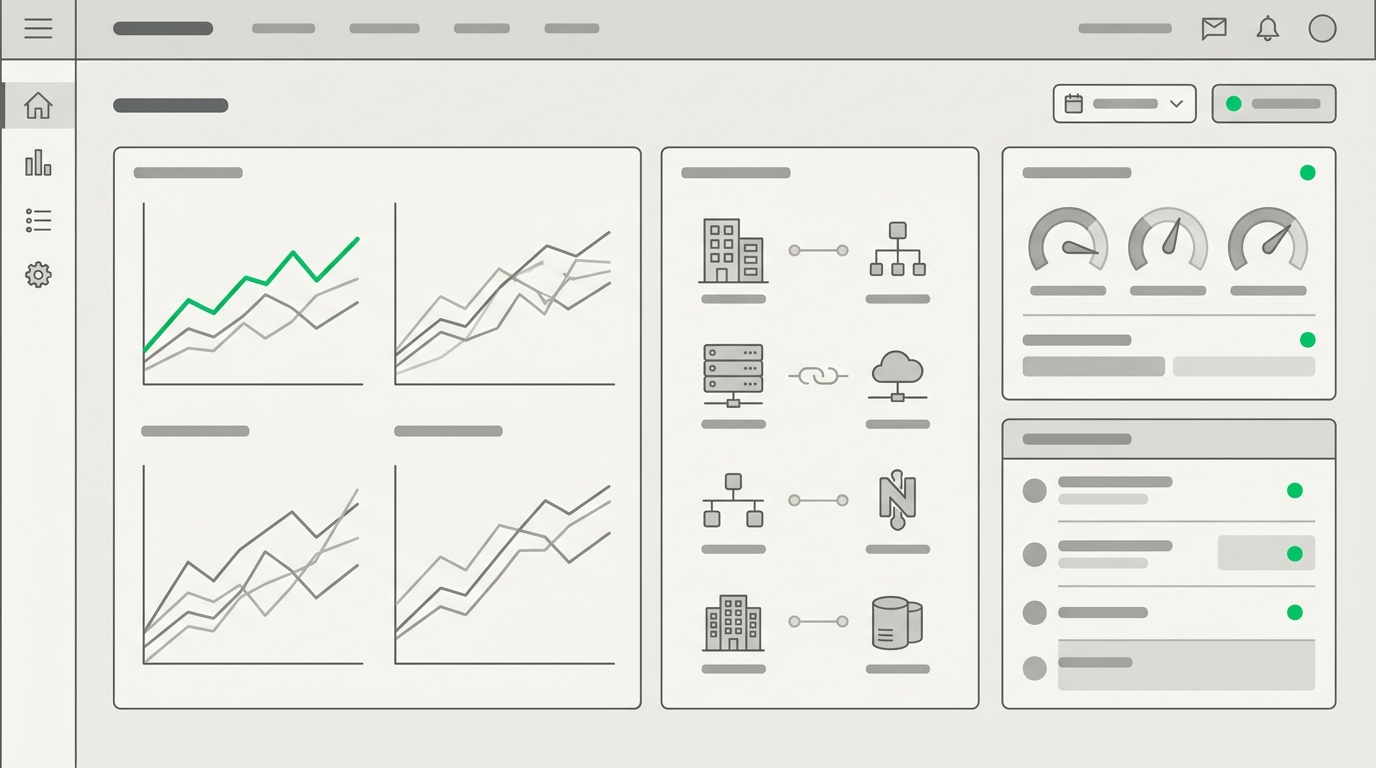
In September 2023, the National Disaster Management Authority reported that India loses an estimated ₹1 lakh crore annually to infrastructure failures, a figure that underscores how consequential delayed anomaly detection can be on bridges, tunnels, and high-rise structures. Traditional threshold-based monitoring systems generate alerts only when a sensor reading crosses a fixed limit — they cannot distinguish a genuine structural event from sensor drift, thermal expansion, or transient traffic loading. An AI-powered SHM dashboard with automated alerts India changes that calculus by applying machine learning models that learn the normal behavioural envelope of a structure and flag deviations before they become failures. This post examines the architecture, alert workflow, and real-world deployment context of intelligent monitoring platforms built for Indian infrastructure conditions.
Key Takeaways
- An AI-powered SHM dashboard with automated alerts India uses ML-based anomaly detection to separate genuine structural events from noise, reducing nuisance alerts that plague fixed-threshold systems.
- Alert workflows can be tiered — advisory, warning, and critical — with escalation logic mapped to IS 1893 seismic zones and IRC SP-35 bridge inspection protocols.
- Digital twin integration, as demonstrated in the RITES 3D Digital Twin and VR Visualization Platform for Bridge Health Monitoring System, allows engineers to visualise sensor anomalies in a georeferenced 3D model rather than a flat data table.
- The MIT-WPU Tunnel Health Monitoring and Digital Twin Excellence Centre, inaugurated by Minister Sh. Nitin Gadkari, serves as a live testbed for AI-enabled SHM research and training in India.
- Intelligent monitoring platforms must handle heterogeneous sensor streams — vibrating wire, MEMS accelerometers, fibre-optic strain gauges, and piezometers — within a single unified dashboard.
What Is an AI-Powered SHM Dashboard
An AI-powered SHM dashboard is a software platform that ingests continuous sensor telemetry from structural instrumentation, applies machine learning algorithms to detect anomalies, and dispatches tiered automated alerts to engineers without requiring manual data review for every reading cycle. This definition is important because it distinguishes the platform from a simple SCADA visualisation tool or a spreadsheet-based data logger interface. The intelligence layer — not the display layer — is what makes the system actionable.
At the sensor level, a modern structural health monitoring software platform must ingest signals from vibrating wire strain gauges (typical resolution: 1 micro-strain), MEMS accelerometers (sampling at 200–1000 Hz for modal analysis), piezometers reporting pore pressure in kPa, and tiltmeters with angular resolution of 0.001°. Each sensor type has a different noise profile, sampling rate, and failure mode. A rule-based threshold system treats all of these identically. An ML model learns the covariance structure across sensor clusters and can detect when a subset of sensors is behaving inconsistently with the rest of the structure — a pattern that often precedes a localised failure.
The dashboard layer then presents this intelligence through georeferenced 3D visualisations, time-series plots, and alert consoles that an engineer on site or in a remote operations centre can act on immediately. For machine learning in structural health monitoring, the quality of the training dataset — ideally drawn from at least one full seasonal cycle of the structure's behaviour — determines model accuracy.
Alert Workflow Architecture for Intelligent Monitoring
The alert workflow in an intelligent monitoring system is not a single trigger but a multi-stage pipeline. Understanding each stage is essential for procurement teams specifying SHM software for NHAI, RVNL, or CWC projects.
Stage 1 — Data ingestion and pre-processing: Raw sensor data arrives via GPRS, LoRaWAN, or wired Modbus/RS-485 links at intervals ranging from 1 second (dynamic monitoring) to 15 minutes (static settlement monitoring). The platform applies outlier rejection, timestamp synchronisation, and unit normalisation before any ML inference runs. Gaps caused by communication dropout are flagged separately so they do not trigger false structural alerts.
Stage 2 — Anomaly scoring: An unsupervised ML model — typically an autoencoder or isolation forest variant — assigns a reconstruction error or anomaly score to each incoming data window. The model's baseline is trained on historical data from the same structure. A score exceeding a statistically derived threshold (commonly 3σ from the mean reconstruction error) advances the reading to Stage 3.
Stage 3 — Contextual filtering: Before an alert is dispatched, the platform checks contextual signals: time of day, ambient temperature from an onboard thermistor, known maintenance windows, and recent seismic events from the IMD feed. A vibration spike coinciding with a logged pile-driving activity nearby is suppressed. This contextual layer is where the majority of nuisance alert reduction occurs.
Stage 4 — Tiered alert dispatch: Alerts are classified as Advisory (monitor closely), Warning (engineer review within 4 hours), or Critical (immediate site inspection). Dispatch channels include SMS, email, and in-app push notifications. For NHAI projects, alert logs are exportable in formats compatible with the Ministry of Road Transport and Highways reporting templates under MORTH's bridge management guidelines.
Stage 5 — Feedback loop: Engineers who dismiss or confirm an alert feed that decision back into the model as a labelled event. Over successive inspection cycles, the model's false-positive rate decreases as it accumulates structure-specific labelled data — a process aligned with the continuous improvement philosophy embedded in IS 13311 for non-destructive testing of concrete structures.
Digital Twin Integration: RITES and MIT-WPU Deployments
Two Geolook deployments illustrate how AI SHM dashboards move beyond flat sensor tables into spatially aware digital environments.
For RITES Ltd, Geolook delivered a 3D Digital Twin and VR Visualization Platform for Bridge Health Monitoring System. In this deployment, sensor readings from strain gauges, accelerometers, and displacement transducers are mapped to corresponding elements in a georeferenced 3D bridge model. When the ML engine flags an anomaly — say, an asymmetric strain pattern across a girder cross-section — the dashboard highlights the affected element in the 3D model, overlays the time-series deviation, and presents the engineer with the structural context needed to make an informed inspection decision. This is materially different from receiving a raw alert that sensor CH-07 has exceeded 450 micro-strain.
At the MIT-WPU Tunnel Health Monitoring and Digital Twin Excellence Centre in Pune, inaugurated by Hon'ble Minister Sh. Nitin Gadkari, the platform serves a dual purpose: live structural monitoring of tunnel instrumentation and a research environment where engineers and postgraduate students can train ML models on real tunnel sensor data. The centre functions as a reference deployment for NATM tunnel monitoring, where convergence measurements (typically reported in mm), shotcrete stress (in MPa), and rock bolt load (in kN) are all ingested into the same AI SHM dashboard. This multi-parameter fusion is precisely the kind of intelligent monitoring capability that NHAI and BRO project managers need when overseeing tunnels in geologically complex corridors.
Explore how Geolook approaches what is the best cloud based software platform for structural health monitoring in india for a detailed breakdown of cloud architecture considerations.
Sensor-to-Dashboard Data Flow: Technical Specifications
For procurement engineers writing technical specifications, the following parameters define the performance envelope of a production-grade AI-powered SHM dashboard with automated alerts India deployment.
Data latency: End-to-end latency from sensor acquisition to dashboard display should not exceed 5 seconds for dynamic monitoring channels. For static channels (settlement, pore pressure), a 15-minute update cycle is standard.
Sensor compatibility: The platform must support vibrating wire interfaces (4–6 kHz frequency range), 4–20 mA analogue inputs, RS-485 Modbus RTU, SDI-12, and digital pulse outputs. Geolook's industrial-grade data acquisition systems are designed to interface with this full range of transducer types without requiring signal conditioning adapters.
Storage and retention: Raw time-series data should be retained at full resolution for a minimum of 5 years, consistent with the inspection cycle requirements under IRC SP-35 for major bridges. Compressed summary statistics can extend retention to the full design life of the structure.
Redundancy: For critical infrastructure, edge computing nodes at the sensor cluster level should buffer up to 72 hours of data locally to prevent data loss during communication outages — a common occurrence in remote NH-44 corridor tunnels in J&K.
API access: RESTful APIs with JSON output allow integration with NHAI's bridge management system, RVNL's project monitoring portals, and third-party GIS platforms. This is a non-negotiable requirement for PSU procurement.
Threshold-Based vs ML-Based Alert Systems: A Comparison
The table below compares fixed-threshold alert systems — still the most common approach in Indian SHM deployments — against ML-based intelligent monitoring platforms across dimensions that matter to structural engineers and project managers.
| Criterion | Fixed-Threshold Alert System | ML-Based Intelligent Monitoring |
|---|---|---|
| Alert trigger logic | Single sensor exceeds a pre-set limit (e.g., strain > 500 micro-strain) | Anomaly score derived from multi-sensor covariance model exceeds statistical threshold |
| Nuisance alert rate | High — thermal expansion, sensor drift, and traffic transients all trigger alerts | Reduced through contextual filtering and learned normal behaviour envelope |
| Seasonal adaptation | None — fixed limits do not account for temperature-dependent structural response | Model retrains on rolling window data, adapting to seasonal thermal cycles |
| Multi-sensor fusion | Each sensor monitored independently; no cross-channel correlation | Correlates strain, displacement, acceleration, and temperature simultaneously |
| Early warning capability | Alerts only after a limit is breached; no pre-failure trend detection | Detects gradual drift in structural response weeks before a threshold is breached |
| False negative risk | High if limits are set conservatively to reduce nuisance alerts | Lower — anomaly scoring is sensitive to pattern change, not just magnitude |
| Compliance mapping | Limits manually mapped to IRC SP-35 or IS 1893 allowables by the engineer | Alert tiers can be automatically linked to code-defined performance levels |
| Maintenance overhead | Requires manual limit review after every significant structural event or repair | Model updates automatically with labelled feedback from engineer confirmations |
Deployment Considerations for Indian Infrastructure Projects
Deploying an AI-powered SHM dashboard with automated alerts India across NHAI, RVNL, or CWC projects involves constraints that differ materially from European or North American deployments. Three factors dominate.
Connectivity: Many critical structures — NH-44 tunnels in J&K, high-altitude BRO bridges, reservoir embankments in remote catchments — have intermittent or low-bandwidth connectivity. The platform architecture must prioritise edge intelligence: ML inference running on the local data logger, with the cloud dashboard receiving pre-processed anomaly scores rather than raw waveforms. This reduces bandwidth requirements by orders of magnitude and ensures alerts are generated even during cloud disconnection.
Seismic context: India's IS 1893 (Part 1): 2016 defines five seismic zones. Structures in Zone IV and Zone V — including bridges and tunnels in the Himalayan belt — require the ML model to distinguish seismic excitation events (characterised by broadband acceleration in mm/s²) from structural damage signatures. Without this discrimination, every moderate earthquake would generate a Critical alert, overwhelming the operations team.
Multi-stakeholder reporting: A single structure may be monitored under contracts involving an EPC contractor, a government authority, and an independent third-party reviewer. The dashboard must support role-based access control, with raw data visible to the monitoring engineer, summary dashboards available to the project manager, and compliance reports exportable for the authority. For transport infrastructure, see how Geolook approaches intelligent monitoring for transport infrastructure across highways, tunnels, and rail corridors.
Understanding the foundational principles behind these deployments is equally important. For engineers new to the field, what is structural health monitoring and why does it matter provides the conceptual grounding needed before specifying an AI-enabled platform.
Data Governance, Calibration, and Model Validation
An AI SHM platform is only as reliable as the data it ingests and the validation regime applied to its models. For Indian public infrastructure projects, this has regulatory implications.
Sensor calibration must comply with IS 13311 (non-destructive testing) and the manufacturer's calibration certificates traceable to NPL India standards. Vibrating wire gauges should be factory-calibrated with a gauge factor certificate; in-situ verification using a portable readout unit should be performed at commissioning and at each annual inspection. Any sensor whose drift exceeds 0.5% of full-scale reading over a 12-month period should be flagged for replacement before the ML model is retrained on its data.
Model validation requires a held-out test dataset — ideally including at least one known structural event such as a controlled load test or a recorded seismic event — against which the model's detection performance can be quantified. Precision and recall metrics, not just overall accuracy, should be reported, because in structural monitoring a false negative (missed event) carries far greater consequence than a false positive (nuisance alert).
For projects under the Dam Safety Act 2021 or CWC guidelines for reservoir monitoring, the audit trail of ML model versions, training datasets, and alert logs must be retained and accessible to the regulatory authority. This is an emerging requirement that procurement specifications for dam SHM should explicitly address.
The broader context of how sensor data flows from field instruments to an analytical platform is covered in our guide to web data monitoring system architecture for structural applications.
Frequently Asked Questions
Q: What is an AI-powered SHM dashboard with automated alerts?
A: An AI-powered SHM dashboard with automated alerts is a software platform that applies machine learning to continuous structural sensor data — strain in micro-strain, displacement in mm, acceleration in mm/s² — to detect anomalies and dispatch tiered alerts without manual data review. It differs from fixed-threshold systems by learning the structure's normal behavioural envelope and filtering contextual noise before alerting engineers.
Q: How does ML-based anomaly detection reduce nuisance alerts in structural monitoring?
A: ML-based anomaly detection reduces nuisance alerts by correlating readings across multiple sensor channels simultaneously and applying contextual filters — ambient temperature, maintenance windows, known traffic or seismic events — before classifying a deviation as a genuine structural anomaly. Fixed-threshold systems cannot perform this cross-channel correlation, so thermal expansion or sensor drift routinely triggers false alerts that erode engineer trust in the system.
Q: Which Indian standards govern alert thresholds in bridge and tunnel SHM?
A: Alert thresholds in Indian bridge SHM are informed by IRC SP-35 (guidelines for inspection and maintenance of bridges), IRC:6 for live load limits, and IS 1893 for seismic performance levels. For tunnels, MORTH guidelines and NATM instrumentation protocols define convergence and stress limits. An intelligent monitoring platform should map its tiered alert levels directly to these code-defined performance thresholds rather than using arbitrary engineering judgement limits.
Q: Can an AI SHM dashboard integrate with a 3D digital twin model?
A: Yes, an AI SHM dashboard can integrate with a 3D digital twin by mapping sensor anomaly scores to georeferenced structural elements in the model, so engineers see which beam, pier, or tunnel section is behaving anomalously rather than interpreting a raw channel number. Geolook's deployment for RITES Ltd demonstrates this integration for bridge health monitoring, with sensor data visualised in a 3D VR-compatible platform.
Q: What connectivity architecture is recommended for SHM in remote Indian infrastructure sites?
A: For remote sites such as high-altitude tunnels or reservoir embankments with intermittent connectivity, an edge-first architecture is recommended: ML inference runs on the local data acquisition node, which transmits pre-processed anomaly scores rather than full raw waveforms to the cloud dashboard. This reduces bandwidth requirements substantially and ensures automated alerts are generated locally even during cloud communication outages, maintaining monitoring continuity under IS 1893 Zone IV and Zone V conditions.
See AI monitoring
Geolook's AI-powered SHM dashboard with automated alerts India is deployed across tunnel, bridge, and high-rise projects for NHAI, RITES, and leading EPCs. If you are specifying an intelligent monitoring platform for an upcoming project — or evaluating whether your existing fixed-threshold system is generating more noise than signal — our engineering team can walk you through the alert workflow, ML model architecture, and integration options relevant to your structure type and regulatory context.
Contact Geolook's structural monitoring engineers to discuss your project requirements and receive a technical overview of the AI SHM dashboard platform tailored to your infrastructure sector.
Project inquiry
Talk to a Geolook™ specialist
Share your monitoring requirement and our team will help identify the right next step.
By submitting, you agree that Geolook™ may contact you about this inquiry. Your details are not added to a marketing list.